Waffle House may seem like an unusual candidate for economic analysis, but as a fixed cultural and commercial institution in the American South, it offers a rare opportunity to track the intersection of wages, consumer prices, and economic transformation over time. Since its founding in 1955 and especially from the 1970s onward, Waffle House has grown into a kind of southern barometer. It doesn’t just serve meals; it reflects the realities of low-wage labor, consumer pricing, and the changing value of human effort.
Unlike chains that change menus and models to chase trends, Waffle House has remained a model of operational stasis. Its core product offerings have changed little. Its staffing model is familiar and stable: servers work primarily for tips, and cooks (called grill operators) move through a hierarchy—entry-level, master, rockstar—based on tenure and skill. Prices and wages are tightly controlled across locations. Server and cook labor have changed little since 1970—little to no automation or augmentation, just slinging waffles and pouring coffee. And because the chain is deeply embedded in rural, suburban, and working-class communities, especially in the South, it offers a grounded picture of economic life far from the abstractions of national averages.

The following analysis tracks key indicators at Waffle House from 1970 to 2025, all adjusted to reflect constant 2025 dollars. The goal is not to tell a story about Waffle House alone, but to use it as a consistent measuring stick for how the value of traditional labor has evolved in the face of broader economic and technological shifts. The skill requirements for servers and cooks are pretty much the same today as they were in 1970 and thus server as a steady proxy for comparisons.
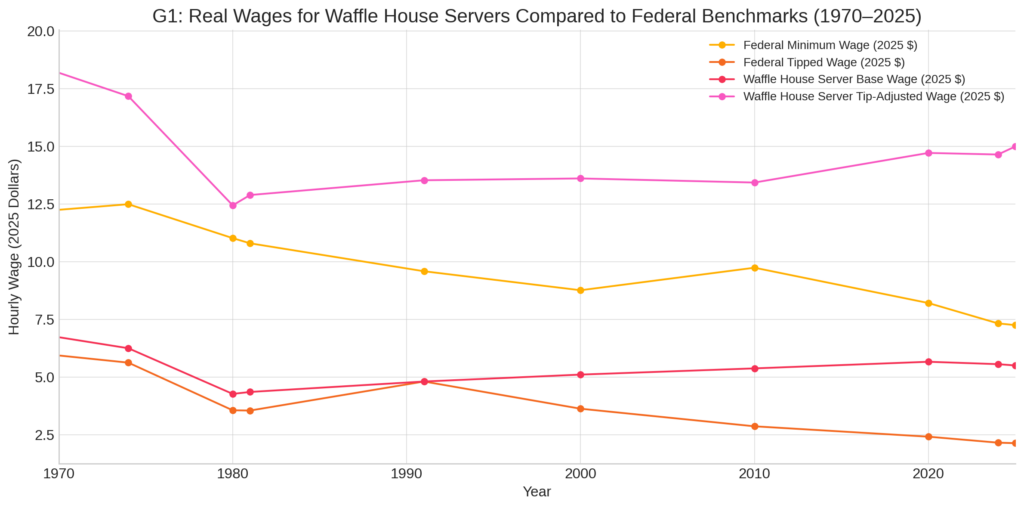
G1: Real Wages for Waffle House Servers Compared to Federal Benchmarks (1970–2025)
The first chart traces the inflation-adjusted wages of Waffle House servers, comparing four key lines: the federal minimum wage, the federal tipped minimum wage, the Waffle House base pay, and estimated tip-adjusted earnings.
In the 1970s, these lines were relatively close together. Over time, they diverged. The tipped minimum wage, unchanged in nominal terms since 1991, has lost most of its value. Base pay rose slightly but remained tied to this floor until recent years. Tip-adjusted earnings show a slight upward trend, but mostly reflect the broader cultural shift toward more generous tipping rather than any structural wage growth.
The key insight from G1 is this: even with tips, server wages have not kept pace with the shifting value of labor in an economy increasingly defined by automation and augmentation in other sectors.
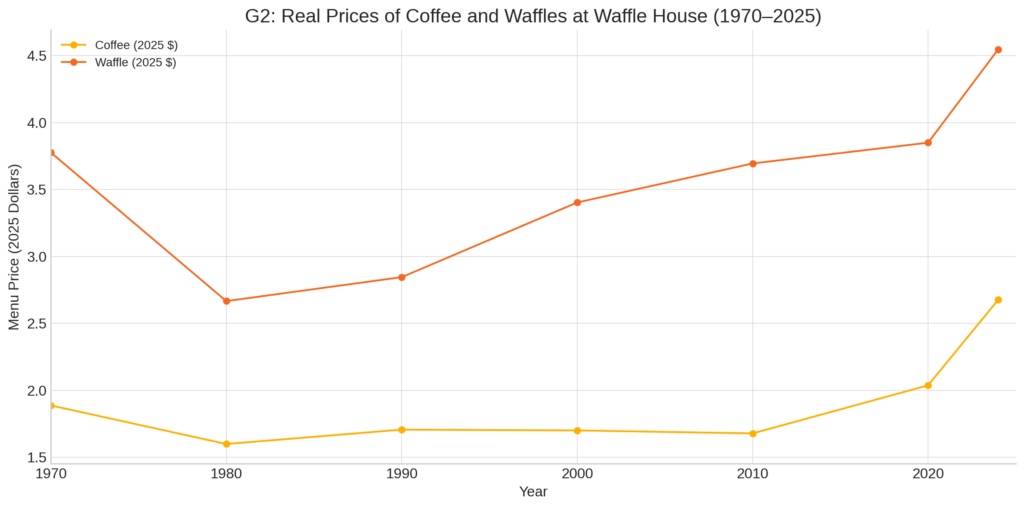
G2: Real Prices of Coffee and Waffles at Waffle House (1970–2025)
G2 tracks the inflation-adjusted cost of two cornerstone menu items—coffee and waffles. Since 1970, both have risen in real terms, but waffles especially so. Coffee more than doubled in price, while waffles nearly quintupled.
These prices are not luxury add-ons; they are foundational items on the Waffle House menu. Their real increase suggests either rising input costs, tighter margins, or growing market tolerance for higher prices. But to the worker, the effect is simple: their own labor buys them less of what they serve.
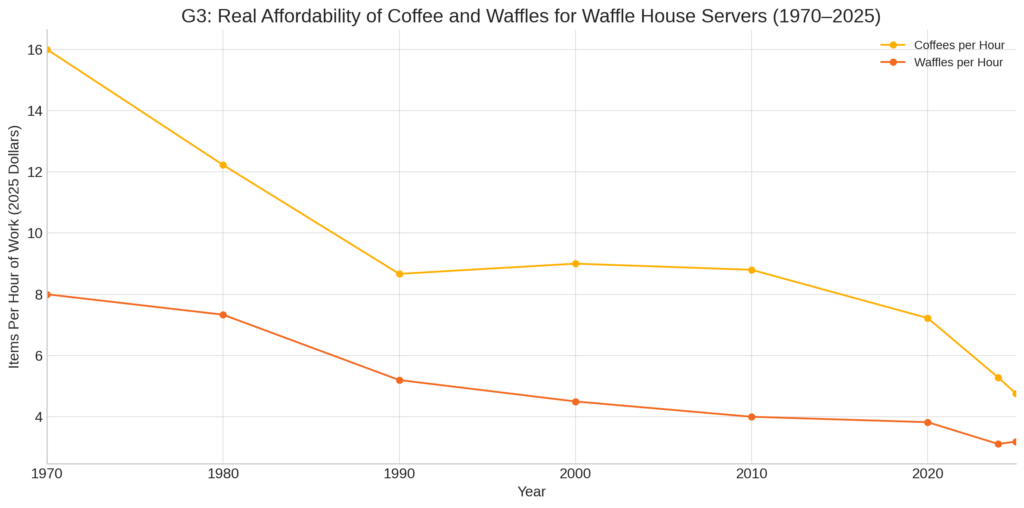
G3: Real Affordability of Coffee and Waffles for Waffle House Servers (1970–2025)
G3 shows what one hour of tip-adjusted server labor can purchase: how many coffees or waffles a worker can afford with their wage.
In the early 1970s, a server could afford nearly 16 coffees or 8 waffles per hour. Today, those numbers have dropped to fewer than 6 coffees and just over 3 waffles. The drop is steep, and it’s not for lack of effort. It’s because real wages in this specific labor sector have not risen in concert with efficiency gains seen elsewhere in the economy.
Where other sectors adopted computers, automation, and robotics to amplify output per worker, food service labor has remained largely analog. As a result, the economic value of a Waffle House server’s time has declined—not because they are doing less, but because others are doing more with less. This is a story not of inflation outpacing workers, but of labor value being redefined.
But there is a further twist. While other sectors became more productive and profitable, the benefits of that transformation were not distributed equally. Increased output per worker in finance, tech, and logistics did raise wages—but mostly for workers in those sectors. The gains were absorbed by companies, shareholders, and capital holders—not redistributed across the economy. So even though food service workers stayed essential, the rising tide of productivity has not lifted all boats.
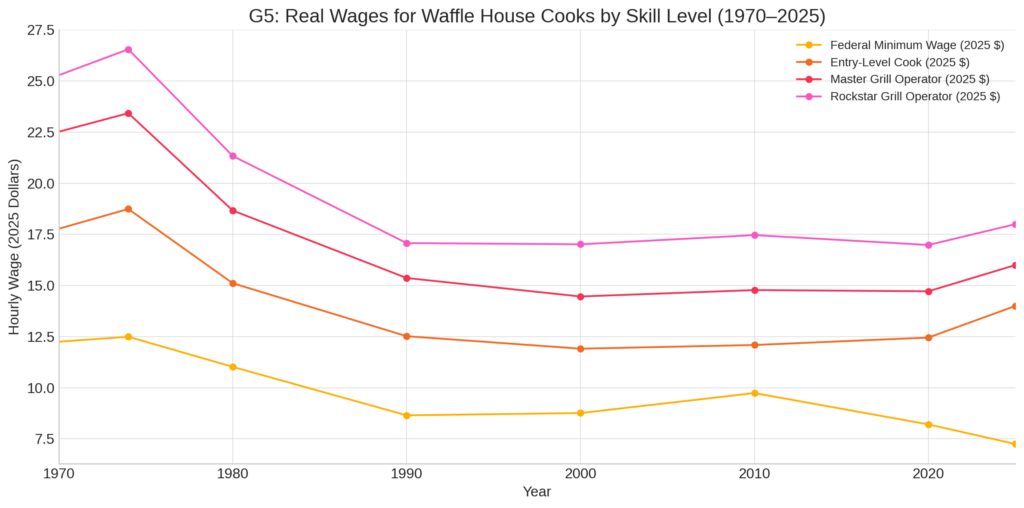
G5: Real Wages for Waffle House Cooks by Skill Level (1970–2025)
G5 (note I omitted G4 by accident, my apologies) expands the focus beyond servers to cooks, segmented by rank: Entry-Level, Master Grill Operator, and Rockstar Grill Operator. All wages are inflation-adjusted to 2025 dollars.
Entry-level cooks have seen modest real gains over time, but Master and Rockstar cooks have made more significant strides, especially since 2000. These gains suggest that Waffle House is willing to reward tenure and skill in its kitchen staff.
Still, even these higher wages are only now approaching the buying power that minimum wage workers had in the late 1960s. And Rockstar wages remain far short of what many living wage models define as necessary for family support.
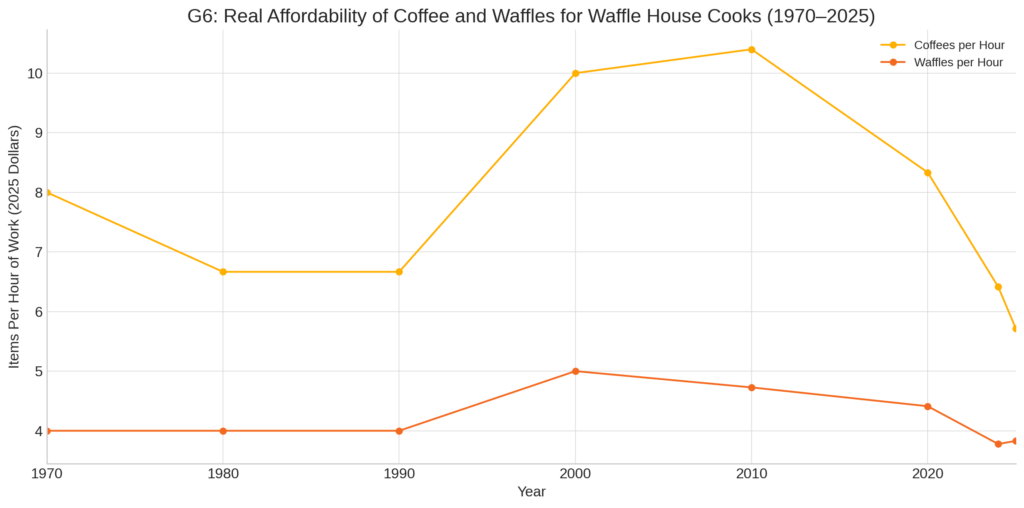
G6: Real Affordability of Coffee and Waffles for Waffle House Cooks (1970–2025)
The final chart, G6, returns to the idea of affordability—this time for cooks. Using Rockstar Grill Operator wages, it measures how many coffees or waffles a cook can buy per hour of work.
As with servers, the 1970s were the high-water mark. Cooks could then afford over 8 coffees or nearly 4 waffles per hour. By 2025, even a top-tier cook earns enough for just 6 coffees or 4 waffles.
This trend is particularly telling because Rockstar wages have risen in nominal and real terms. Yet even with those gains, purchasing power is still down compared to the 1970s.
Conclusion: The Changing Value of Labor
The takeaway from this analysis is not just that wages have failed to keep up with inflation, but that inflation itself reflects deeper structural changes in the economy. In sector after sector, labor has been amplified by technology—through automation, software, and robotics. The result is that workers in those sectors can produce more per hour, justifying higher wages.
Waffle House labor—servers and cooks—has not experienced such augmentation. The tools of their trade have changed little since the 1970s. Their work remains manually intensive and low-leverage. And so, their relative economic value has diminished.
This explains why, even though menu prices have risen, and wages have technically increased, workers can afford less. It’s not just about money; it’s about output. In 1970, a worker might “buy” coffee or waffles from Waffle House because it was more efficient than making it at home. In 2025, with cheap home appliances and pre-made options, the logic has reversed. Many now choose to “make” instead of “buy” because the labor cost at Waffle House is no longer competitive with automation at home.
Waffle House is not just a restaurant. It is a mirror to the broader question: what happens to the value of traditional labor when the rest of the economy moves on without it—and decides not to look back?
Disclosure:
Parts of this post were developed with the assistance of ChatGPT, an AI language model created by OpenAI. While the arguments and perspectives are my own, I used AI as a collaborative research and drafting tool to organize thoughts, generate visualizations, and refine language. Any errors in judgment, interpretation, or history are still mine to claim.
