I’m deep into the revisions for the updated paperback of The Art of the Compromise. Chapters 2 and 3 are now complete—expanded by about 20% with fresh narrative, tighter analysis, and over 25 new figures and graphs that dig deeper into how our factions collide and (sometimes) resolve their differences.
One of the biggest additions: new visual data tracing how the South lost control of the presidency, Congress, and the courts leading up to the Civil War—and what that historic loss tells us about power shifts today. There’s also a sharper look at the U.S. population growth by region, free vs. slave states, and the hidden math of compromise in our political DNA.
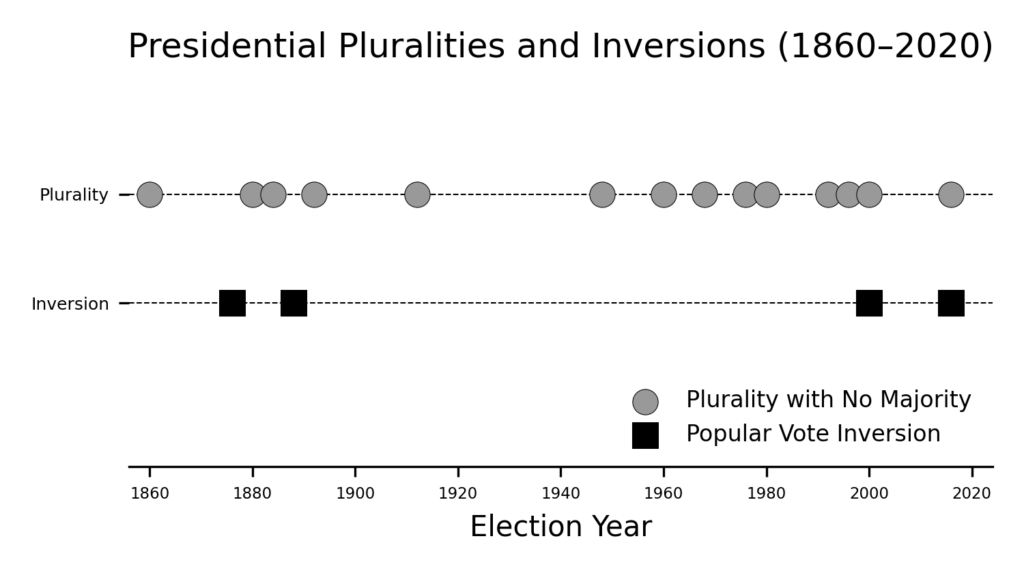
The graph below is an interesting one. It has more meaning in the book discussion, but to take a quick look. It’s showing the US presidential elections. The top row shows where a president was elected with only a plurality and without a majority. That is to say, more people voted against the winning president than voted for them. This case happens more often than the more well-known Electoral College inversion whereby a candidate wins the popular vote (almost always a plurality), but does not win the Electoral College.

The point of the figure is to highlight the more common problem—and in my view more serious one—that an individual to ascend to the presidency without some sort of majority, if we followed a plurality-based election system.
Next up are Chapters 4 and 5. I expect a few late nights with my notes, my charts—and, of course, my cheerful robot assistant (thank you, ChatGPT). If all goes to plan, I’ll have the final manuscript in your hands this August.
Stay tuned. More updates soon. Compromise is never easy—and it ain’t for the weak. Stay strong.
